Notice

The daily observed maps have been discontinued due to a change to the National Fire Danger Rating System.

Fire Danger Maps
and Fire Danger Index (FDI) Report

Forecast Weather Map

FDI Forecast

  Forecast (for March 29, 2023)
County RH (%) ERC FDI
Alachua 45 24 1
Baker 41 20 2
Bay 46 18 1
Bradford 46 21 1
Brevard 67 20 1
Broward 57 22 1
Calhoun 45 18 1
Charlotte 64 19 1
Citrus 51 23 1
Clay 51 19 1
Collier 51 23 1
Columbia 43 21 1
DeSoto 60 22 1
Dixie 46 22 1
Duval 50 22 1
Escambia 42 26 2
Flagler 55 20 1
Franklin 41 21 2
Gadsden 45 19 1
Gilchrist 43 23 1
Glades 57 24 1
Gulf 42 21 2
Hamilton 42 20 2
Hardee 60 23 1
Hendry 55 23 1
Hernando 52 21 1
Highlands 59 26 2
Hillsborough 61 20 1
Holmes 46 22 1
Indian River 64 26 2
Jackson 49 17 1
Jefferson 48 18 1
Lafayette 49 17 1
Lake 49 25 1
Lee 63 22 1
Leon 46 20 1
Levy 53 17 1
Liberty 42 17 1
Madison 51 17 1
Manatee 64 21 1
Marion 43 21 1
Martin 61 26 2
Miami-Dade 50 23 1
Monroe 47 23 2
Nassau 46 21 1
Okaloosa 40 24 2
Okeechobee 55 20 1
Orange 54 31 2
Osceola 58 25 1
Palm Beach 59 23 1
Pasco 52 22 1
Pinellas 65 12 1
Polk 53 29 2
Putnam 50 21 1
Santa Rosa 35 30 3
Sarasota 74 15 1
Seminole 59 25 1
St. Johns 57 17 1
St. Lucie 62 27 2
Sumter 51 22 1
Suwannee 47 19 1
Taylor 51 18 1
Union 46 21 1
Volusia 59 25 1
Wakulla 45 20 1
Walton 46 19 1
Washington 47 18 1

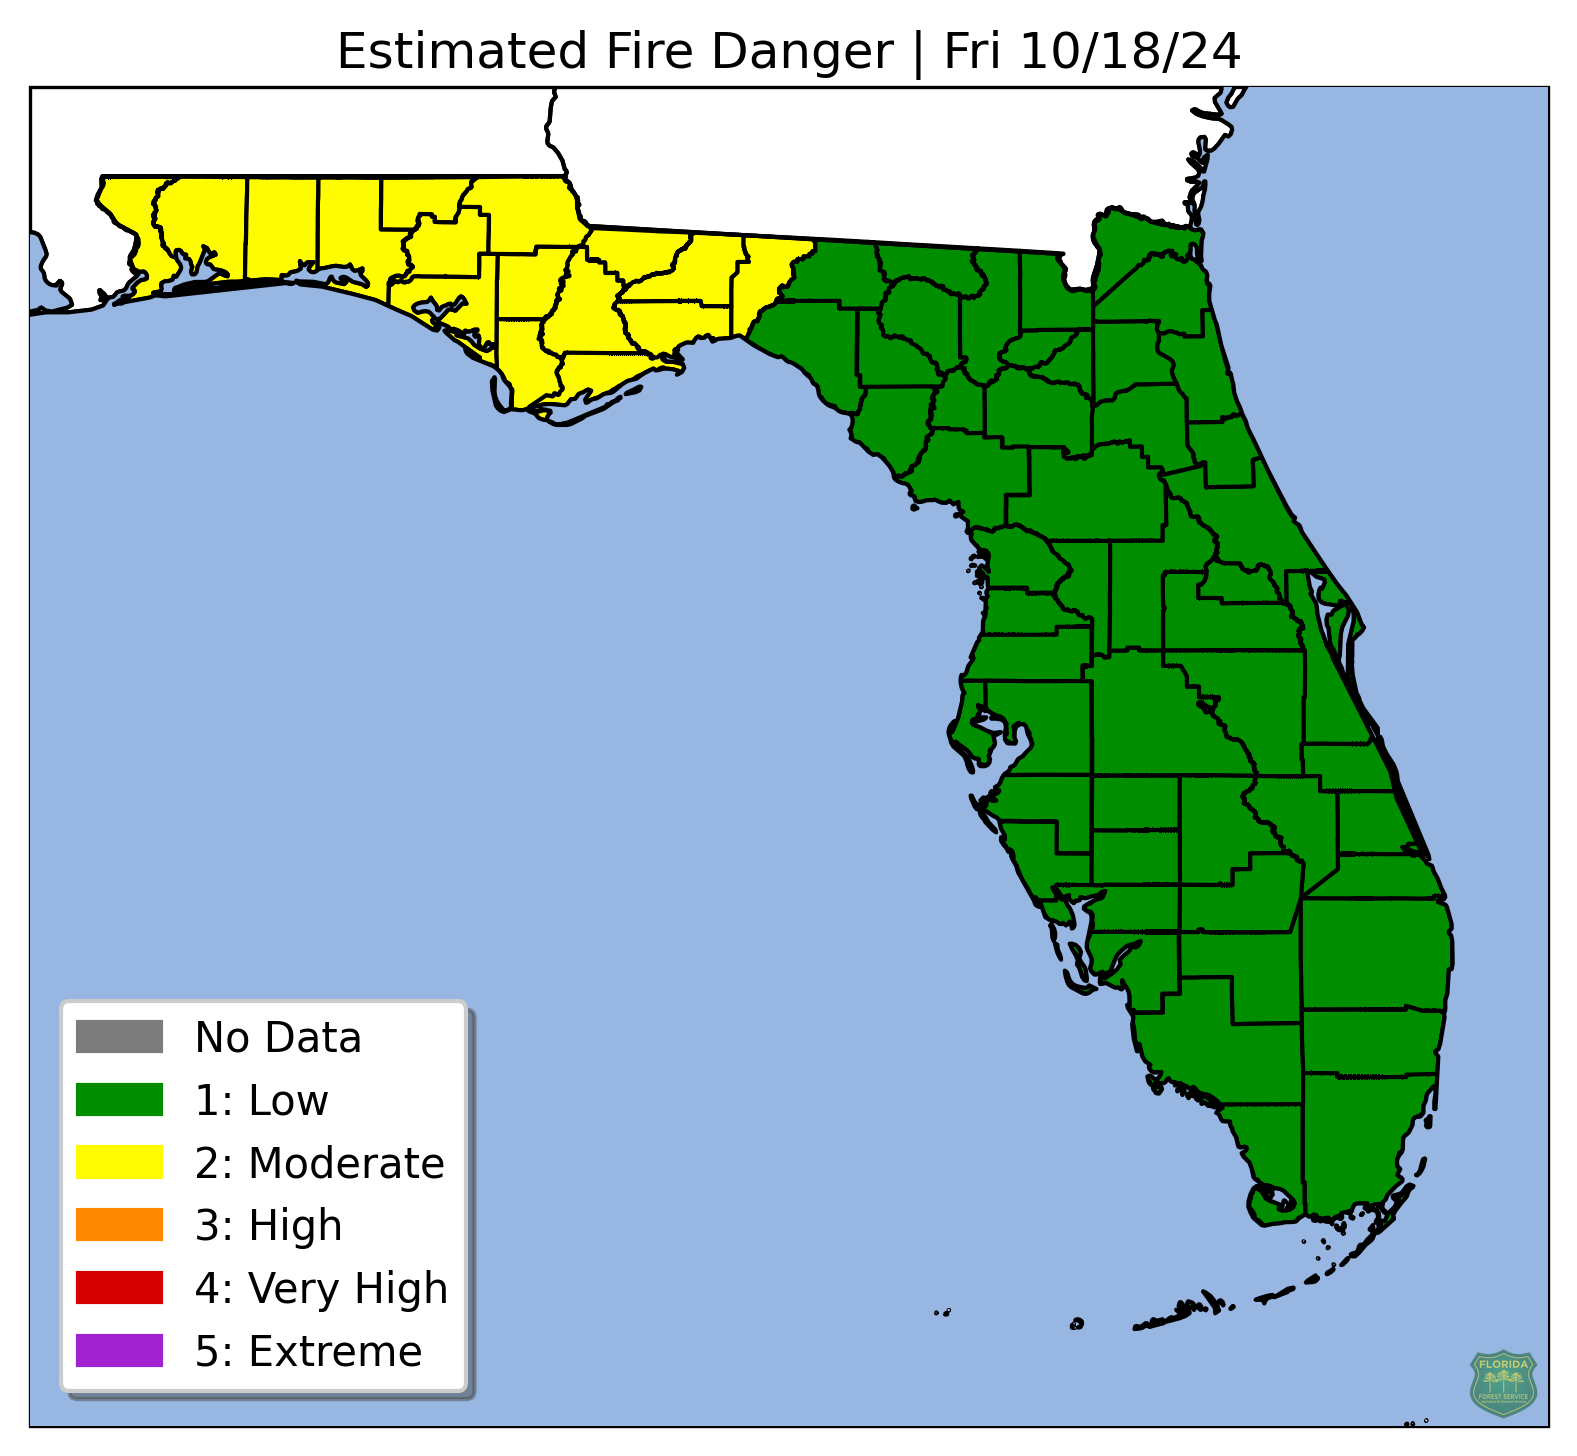
The Florida Forest Service uses the Wildland Fire Danger Index (FDI) for estimating the potential for a fire to start and require suppression action on any given day.
It does not consider how quickly any fires that do start will grow, or how difficult they will be to suppress.
Updated once every day at 4:45 p.m. Eastern / 3:45 p.m. Central.